METHODOLOGY
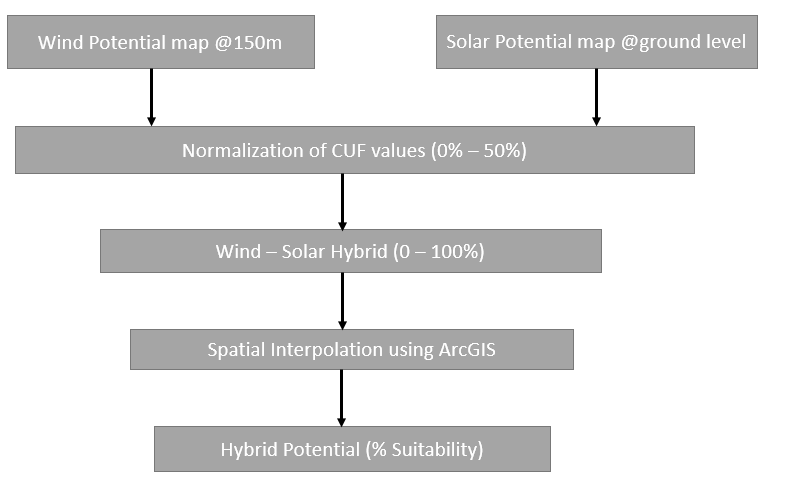
The Wind-Solar Hybrid Map has been prepared by combing the wind potential map at 150 agl and solar atlas prepared by National Institute of Wind Energy (NIWE), Chennai. Both the maps are combined in terms of %CUF at the 500m spatial resolution. In order to estimate the hybrid suitability, the %CUF values of both the maps are initially normalized to 0 – 50% and added together to the maximum value of 100%. The regions with Wind %CUF more than 35% and solar %CUF more than 20% are considered as the most suitable sites for Hybrid with suitability factor of 100%. The aforesaid methodology Shown in below flow chart.

Combined CUF (%) Estimation:
Combined %CUF is defined as the ratio of the actual energy supplied from a hybrid plant over the year to the maximum possible energy that can be supplied against the declared project capacity at injection point (delivery point) in a year. The combined %CUF in general varies with respect to the combination of wind and solar plant capacity. As per the National Wind-Solar Hybrid Policy, a wind-solar plant will be recognized as hybrid plant if the rated power capacity of one resource is at least 25% of the rated power capacity of other resource. Considering the same, the combined %CUF in this study has been estimated for five combinations viz., 75% Wind: 25% Solar, 67% Wind: 33% Solar, 50% Wind: 50% Solar, 33% Wind: 67% Solar, 25% Wind: 75% Solar with the predefined injection capacity and shown as the bar graph.
An example case for the Combined %CUF estimation methodology used in this study is shown in the below table;
Assumption:
Hybrid Plant Capacity: 10 MW
Wind %CUF :30%
Solar %CUF: 20%.
| Hybrid Plant Capacity (MW) |
Assumed Ratio of Wind and Solar Contribution (Wind: Solar) |
Wind Share in the Hybrid plant (MW) |
Solar Share in the Hybrid plant (MW) |
Wind Power Generation (MWh) |
Solar Power Generation (MWh) |
Wind and Solar Combined Generation |
Combined CUF (%) |
| 10 |
75:25 |
7.5 |
2.5 |
19710 |
4380 |
24090 |
27.5% |
| 67:33 |
6.7 |
3.3 |
17608 |
5782 |
23389 |
26.7% |
| 50:50 |
5 |
5 |
13140 |
8760 |
21900 |
25% |
| 33:67 |
3.3 |
6.7 |
8672 |
11738 |
20411 |
23.3% |
| 25:75 |
2.5 |
7.5 |
6570 |
13140 |
19710 |
22.5% |
Another important aspect of Hybrid plant is defining the plant capacity at the delivery point, which requires a detailed site-specific study based on the wind and solar time series energy generation. However, due to non-availability of time-series data for all the grid cells and as the main objective of this study is prospecting - to indicate new wind solar hybrid project areas, the Hybrid plant capacity at the delivery point is predefined in this study for the Combined %CUF estimation.
Hybrid (Wind-Solar) Map Portal
The wind-solar Hybrid portal gives an updated overview of the hybrid suitability of various regions of India based on numerical model data set.
The information provided here are expected to serve as the basis for preliminary site assessment during the prospecting phase of wind-solar hybrid project developments in the country. Further, the information will be useful for all stakeholders of the sector including the policy makers, private players, government agencies in their efforts towards achieving the country’s RE goals.
The basic functions of the portal are briefed below for the easy access;
- Select the required location either by;
- Double clicking on the map directly or
- Entering the Latitude & Longitude of the location and clicking the submit button.
- Once you enter the point / click the required location, the following information will appear will appear on the left side of the dashboard;
- Latitude of the nearest grid point
- Longitude of the nearest grid point
- Wind speed (m/s)
- Wind Power Density (W/sq.m)
- Global Horizontal Irradiance – GHI (kWh/Sq.m/Yr)
- Direct Normal Irradiance – DNI (kWh/Sq.m/Yr)
- Annual Wind Energy Generation per MW (GWh)
- Wind CUF (%)
- Annual Solar Energy Generation per MW (GWh)
- Solar CUF (%) and


